


Strava, the social network for athletes, have released their 2016 end-of-year report collating statistics from a staggering 27.4 million bike rides and 16.9 million runs worldwide. The results provide a wealth of data, including tangible evidence for the fastest, toughest, longest-riding - and laziest - regions of the UK.
So which region is King of the Mountain; and whose cyclists are shaming their city harder than Boris Johnson on a zipline? Check out some of the key findings below - and, without wanting to give anything away, if you're Northern Irish then prepare for your proudest day since the launch of the Titanic.
Before we get into the competitive stuff though, here are some general figures that underline just how popular cycling is in the UK these days:
- 27 million rides uploaded
- 6.9 billion metres climbed
- 803 million km ridden
- 145,041 centuries (100 mile rides) completed
The most active day for UK cyclists was Sunday 8 May. Coincidentally - or not - at least a dozen sportives took place that day, including biggies like the Fred Whitton Challenge, the Etape Caledonia, the HOY 100 and the Wiggle Jurassic Beast. (A quick glance at my own Strava history shows I chipped in 37.7km of my own that day - every little helps!)
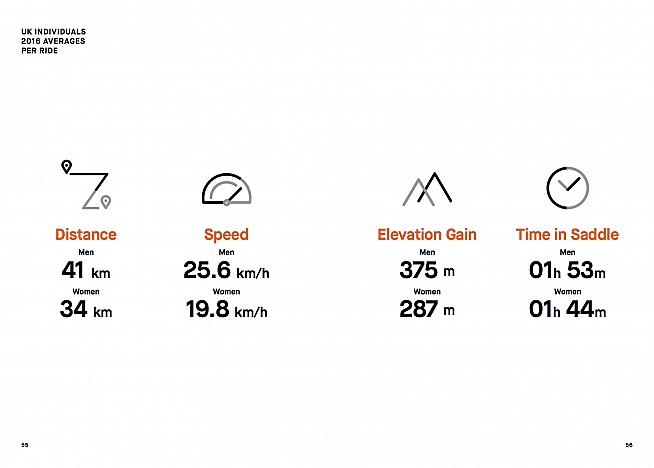
When it comes to distance ridden and times spent cycling, men posted a yearly average of 615km (28h 38m), while women averaged 324km (16h 35m). While there are plenty of women who regularly clock up 300km in a week, let alone a year, casual observation on a typical sportive indicates that male cyclists still heavily outnumber women, although change is happening. It's interesting to note that the average ride duration for men and women is very similar - just 9 minutes separate the men at 1 hour 53 minutes from the women at 1 hour 44.
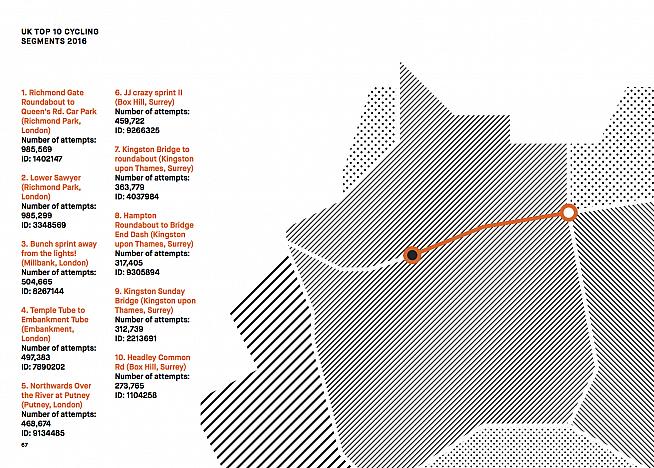
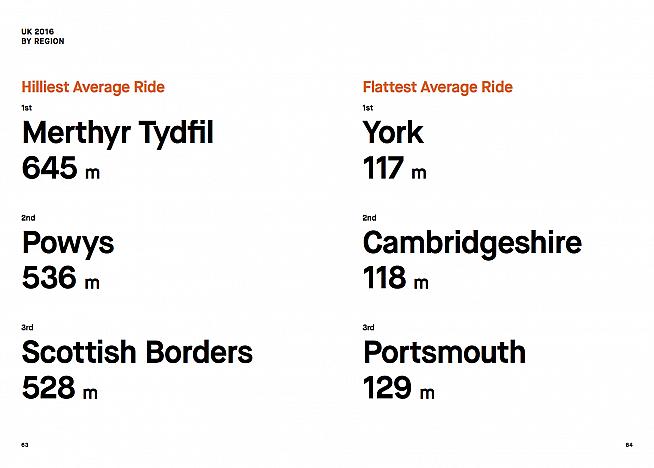
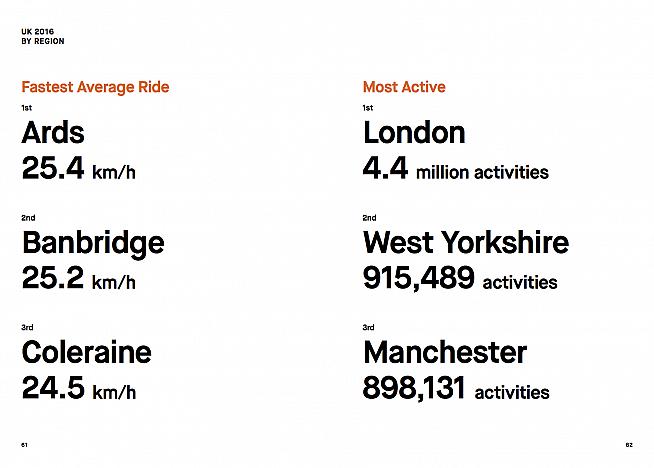
On to performance by region, and according to Strava, Welsh cyclists tackled the hilliest rides, while London and Surrey had the most popular segments. London was also the most active region of the UK with 4.4 million activities, while West Yorkshire (915,489) and Manchester (898,131) complete the podium.
It would be interesting to know how many of those Manchester rides were posted by riders based at the city's National Cycling Centre, home to British Cycling and Team Sky... But what the figures do suggest is that, outside of London, northern cyclists are boss.
On which note, I promised Northern Irish cyclists a treat. Brace yourselves, because amazingly, the region's cyclists have scooped all three podium places in not one but two categories: fastest average speed, and longest average ride:
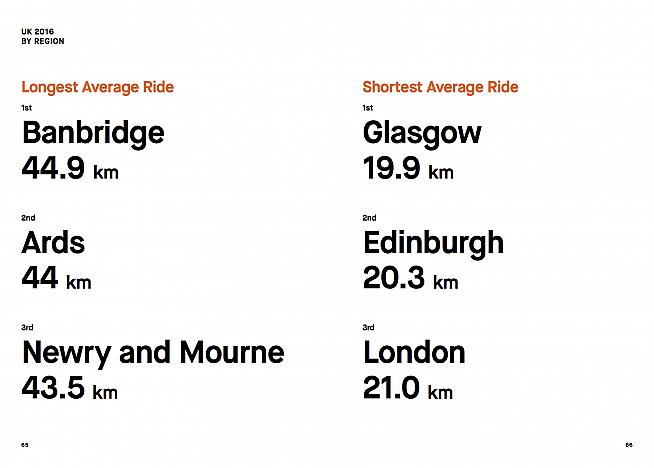
At the other end of the scale, Glasgow (19.9km), Edinbugh (20.3km) and London (21km) posted the shortest average rides. Not that we'd actually brand their cyclists lazy: it seems more likely the numbers reflect a greater proportion of short cycle commutes to longer club rides in these urban centres.
And this leads us neatly to a key point: the Strava data is useful for more than just regional bragging rights. The ability to tag your ride as a commute means Strava have some interesting data on cyclists' journeys to and from work; for example, the average distance for a cycle commute is 13.5 km with a journey time of 35 minutes, for an average speed of 22.4 km/h. Good luck matching that on a London bus.
Unsurprisingly, there's significant seasonal fluctuation, with the summer months seeing an 87% increase in people cycling to work. Strava also note that 79,879 cyclists uploaded a commute on 10th May, the first ever Global Bike to Work Day - apparently saving 514 tons of carbon emissions by not driving to work that day.
To put that figure in a more meaningful context, that's the weight of 68,572 race-ready Pinarello Dogma F8s. Almost as many as you'll see on Box Hill of a Sunday...
KOMs and kudos aside, there is clearly huge scope to apply the vast amount of data harvested by Strava in areas such as urban planning and transport infrastructure. This potential is already being tapped: over 70 cities, including Glasgow in the UK, are currently using Metro, a Strava service that anonymizes and aggregates ride data and then partners with city planners to improve infrastructure for cyclists and pedestrians. (Attention Glasgow cyclists! Please do not abuse this by organising mass bike rides between Ibrox and Celtic Park, resulting in construction of a multi-lane cycleway between the two stadiums.)
So there you have it: Strava isn't just a way for over-competitive geeks to scrutinise their 20-minute commute over their morning coffee - it's helping shape our environment, and maybe even influence government policy.
For more fun facts from the Strava database, check out the news at blog.strava.com soon. And, if you're looking for a Strava challenge to keep you motivated over the winter, why not enter the freshly launched Rapha Festive 500 with a chance to win a custom-made Moots bike.
0 Comments